
Pediatric Hypertension Risk Calculator
Child Information
Risk Assessment Results
Key Takeaways
- Childhood hypertension often slips under the radar because kids rarely show obvious signs.
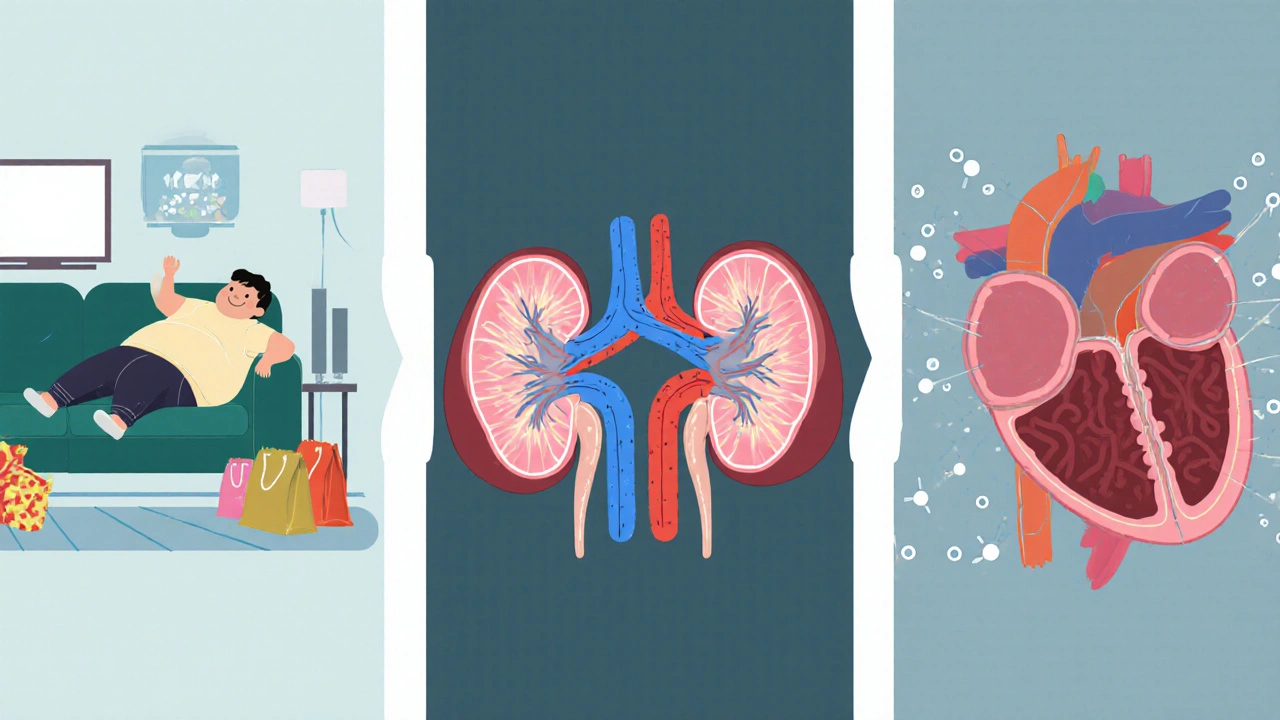
- Obesity, kidney problems, and certain heart conditions top the list of causes.
- Frequent headaches, vision changes, and unusually fast heartbeats are common clues.
- First‑line treatment focuses on lifestyle tweaks; medication is reserved for persistent high readings.
- Regular monitoring and early intervention can prevent adult‑era heart disease.
Understanding pediatric hypertension starts with a clear definition. Hypertension in Children is a condition where a child’s systolic or diastolic blood pressure consistently exceeds the 95th percentile for age, sex, and height. Unlike adult hypertension, the thresholds shift as kids grow, making accurate measurement crucial.
What Triggers High Blood Pressure in Kids?
Several factors push a youngster’s numbers north. Below is a breakdown of the most frequent culprits.
| Cause Category | Typical Examples | How It Raises Pressure |
|---|---|---|
| Obesity & Lifestyle | High‑calorie diet, sedentary habits | Increases sympathetic activity and insulin resistance |
| Kidney Disease | Glomerulonephritis, renal dysplasia | Impairs sodium excretion, activates renin‑angiotensin system |
| Congenital Heart Issues | Coarctation of the aorta, left‑ventricular outflow obstruction | Creates pressure gradients that elevate systemic pressure |
| Endocrine Disorders | Thyroid disease, Cushing’s syndrome | Hormonal excess drives fluid retention and vasoconstriction |
| Genetic/Secondary Factors | Family history, prematurity, certain medications | Alters vascular tone or renal handling of salt |
Among these, Obesity is the leading modifiable risk factor, affecting roughly 30% of hypertensive children in recent Australian cohorts
Kidney disease, though less common, accounts for about 10‑15% of cases and often signals a secondary form that needs specialist care.
Spotting the Warning Signs
Kids rarely complain about pressure, but subtle clues emerge.
- Headaches, especially in the morning.
- Blurred vision or eye strain.
- Rapid heartbeats that feel “fluttery”.
- Fatigue after mild activity.
- Occasional nosebleeds (more common in severe cases).
If a child presents any of these, especially alongside risk factors like obesity, it’s worth checking their blood pressure using an appropriately sized cuff and averaging three readings
How Doctors Confirm the Diagnosis
Measuring pressure isn’t enough; doctors follow a systematic work‑up.
- Take three separate readings on different occasions.
- Plot the numbers on age‑, sex‑, and height‑specific charts (the AAP2017 tables are the standard).
- If clinic readings are borderline, order Ambulatory Blood Pressure Monitoring (ABPM) a 24‑hour device that records pressure during sleep and activity, helping rule out white‑coat effects.
- Run labs: serum creatinine, electrolytes, urinalysis, and fasting glucose to hunt for secondary causes.
- Imaging if needed: renal ultrasound, echocardiogram for heart defects.
The American Academy of Pediatrics (AAP) provides the current screening recommendations, urging annual checks for kids over three years old who are overweight, and bi‑annual checks for those with known risk factors

Putting the Pressure Down: Treatment Strategies
Therapy splits into two camps: lifestyle tweaks first, medication if numbers stay high.
Lifestyle First
- Nutrition: Reduce sodium (aim for <1500mg/day), boost fruits, veggies, whole grains.
- Physical Activity: At least 60minutes of moderate‑to‑vigorous exercise daily-think swimming, bike rides, team sports.
- Weight Management: A 5‑10% body‑weight drop can lower systolic pressure by 5‑8mmHg.
- Screen Time: Limit to <2hours per day; excessive screen time correlates with higher BP.
When Medication Becomes Necessary
Doctors reserve drugs for kids whose BP stays above the 95th percentile despite lifestyle changes for three months, or for those with organ damage.
- ACE inhibitors such as enalapril, block the renin‑angiotensin system and are first‑line for many secondary cases
- Calcium channel blockers like amlodipine, work well for isolated systolic hypertension
- Beta‑blockers e.g., atenolol, are useful when a heart condition co‑exists
- Diuretics are added only if fluid overload is evident.
Dosages are weight‑based, and kids need regular labs to monitor kidney function and electrolytes.
Monitoring Progress
After starting any regimen, doctors check BP every 1‑2months until stable, then shift to quarterly visits. ABPM may be repeated annually to ensure there’s no nocturnal surge.
Living Beyond the Diagnosis
Even after blood pressure normalizes, the risk of adult cardiovascular disease persists.
- Maintain a heart‑healthy diet throughout life.
- Keep up regular exercise-skeletal muscle improves vascular function.
- Annual BP checks become part of routine health screenings.
- Educate the child on self‑monitoring, especially if they have a chronic kidney condition.
Early control dramatically cuts the chance of stroke, left‑ventricular hypertrophy, and chronic kidney disease later on.
Frequently Asked Questions
How common is hypertension in children?
Recent Australian surveys show about 2‑3% of school‑aged children meet the criteria for hypertension, with prevalence climbing to 5‑6% among those classified as obese.
Can a child’s blood pressure return to normal without medication?
Yes, especially when the high readings stem from lifestyle factors. A combined approach of reduced sodium, increased activity, and weight loss often brings numbers back below the 95th percentile within three to six months.
What’s the difference between primary and secondary hypertension in kids?
Primary (essential) hypertension has no identifiable cause and is linked to genetics and obesity. Secondary hypertension arises from a specific problem-most often kidney disease, heart defects, or endocrine disorders-and requires treating that underlying issue.
Is home blood pressure monitoring reliable for children?
When an appropriately sized cuff is used and the child sits quietly for five minutes before each reading, home measurements can be very accurate. They’re especially useful for spotting white‑coat hypertension.
What long‑term complications should families watch for?
If uncontrolled, high blood pressure can lead to left‑ventricular hypertrophy, early atherosclerosis, and chronic kidney disease. Regular cardiac echo and kidney function tests help catch these issues early.
Joery van Druten
October 6, 2025 AT 12:28Thanks for putting together this pediatric hypertension risk calculator. It's a solid step toward catching high blood pressure early in kids. I’d suggest adding a brief explanation of why BMI thresholds differ for children versus adults. Also, a link to the American Academy of Pediatrics guidelines would be useful for parents looking for more detail.
Melissa Luisman
October 11, 2025 AT 05:48This tool is useless until you actually validate it with real patient data.
Akhil Khanna
October 15, 2025 AT 23:08Great job!! 🙌 This calc can really help parents spot issues early. Just a heads up, make sure the input fields validate numbers, otherwise you’ll get weird results 😅. Keep it up!
Zac James
October 20, 2025 AT 16:28The interface is clean and the risk categories are easy to understand. Including family history as a factor makes sense given the genetic component. It would be helpful to see a reference to the underlying study that determined the scoring.
Arthur Verdier
October 25, 2025 AT 09:48Oh wow, another calculator that tells you what you already know-if your kid is older than 10 and a bit chubby, they might have high blood pressure. Groundbreaking stuff.
Breanna Mitchell
October 30, 2025 AT 02:08Hey, I get the sarcasm, but this actually gives families a quick snapshot they can bring to their pediatrician. It’s not a diagnosis, just a conversation starter.
Alice Witland
November 3, 2025 AT 19:28Sure, because every parent has time to fill out a form while juggling school runs. Still, better than guessing blindly.
Chris Wiseman
November 8, 2025 AT 12:48When we talk about pediatric hypertension, it’s crucial to remember that the physiological mechanisms differ markedly from adult‑onset hypertension, and this calculator, though simplistic, nudges us toward that awareness. First, the inclusion of age as a binary factor (>=10 years) captures the transitional puberty period where hormonal shifts can sway vascular resistance. Second, the BMI weighting aligns with the growing body of evidence linking adolescent obesity to elevated systolic pressures, yet the thresholds used here could benefit from a percentile‑based approach rather than absolute numbers. Third, family history being split into one or both parents is a nice touch, but the tool might be further refined by considering sibling history and possibly ethnic background, both of which modulate risk. Fourth, the symptom checklist-a handful of relatively nonspecific signs like headaches and fatigue-provides a useful clinical cue, but a more nuanced symptom scoring could differentiate between primary hypertension and secondary causes such as renal disease. Fifth, the risk score aggregation, while straightforward, treats each symptom equally, which might over‑inflate risk in a child who merely experiences an occasional headache due to dehydration. Sixth, the user experience could be enhanced by adding tooltips that explain why each factor is weighted the way it is, thereby educating caregivers in real time. Seventh, from a public health perspective, disseminating this calculator through schools or community health fairs could catch cases that otherwise slip through routine check‑ups. Eighth, the visual risk level output-low, moderate, high-is clear, but adding a brief recommendation textbox for each tier would guide families on next steps, such as lifestyle modifications or scheduling a specialist visit. Ninth, given that blood pressure norms vary with height percentile in children, incorporating a height‑adjusted reference could improve accuracy dramatically. Tenth, it would be prudent to include a disclaimer reminding users that this is a screening tool and not a substitute for professional medical evaluation. Eleventh, the code itself is tidy, but commenting on the algorithm would aid future developers who wish to adapt or expand it. Twelfth, consider adding a data export feature so clinicians can pull the results into electronic health records for longitudinal tracking. Thirteenth, integrating a brief educational module on dietary sodium reduction could turn this calculator into an actionable intervention platform. Fourteenth, while the current design is responsive, testing on low‑bandwidth connections would ensure accessibility in underserved regions. Fifteenth, a multilingual version would broaden reach, especially in communities where English isn’t the primary language at home. Finally, kudos to the team for tackling a niche yet vital health issue-continued iteration and validation will only make this tool more robust and trustworthy.
alan garcia petra
November 13, 2025 AT 06:08Thanks for the thorough breakdown. I’ll try the calculator and see what it says about my kid.
Allan Jovero
November 17, 2025 AT 23:28Whilst the calculator presents a commendable initiative, it would be advisable to rectify the occasional typographical inconsistency observed within the interface, specifically the interchanging usage of “BMI” and “bmi”. Additionally, the term “riskScore” ought to be presented as “risk score” to align with conventional nomenclature.
Andy V
November 22, 2025 AT 16:48Looks decent, but the lack of proper units for weight (kg) and height (cm) is a glaring oversight that could mislead users.
Tammie Sinnott
November 27, 2025 AT 10:08Did you know that pediatric hypertension has surged by 30% in the past decade, largely due to sedentary lifestyles and processed foods? This calculator arrives just in time to shine a light on a silent epidemic that’s been ignored for far too long.
Michelle Wigdorovitz
December 2, 2025 AT 03:28Yo, this thing is legit! If your kid’s got any of those symptoms, don’t chill-plug the numbers in and get that risk level ASAP. Better safe than sorry, fam.
Arianne Gatchalian
December 6, 2025 AT 20:48I appreciate the effort put into this tool. It could serve as a bridge between worried parents and healthcare providers, fostering a collaborative approach to early detection and management.
Aly Neumeister
December 11, 2025 AT 14:08Wow!!!, this calculator, is, surprisingly, quite, user‑friendly, however, it, could, benefit, from, clearer, instructions, on, how, to, interpret, the, risk, categories, !!!
joni darmawan
December 16, 2025 AT 07:28The provision of a risk assessment algorithm represents a significant contribution to pediatric preventive medicine, provided that it is employed alongside professional clinical judgement.
Richard Gerhart
December 21, 2025 AT 00:48Great job on this! I think it’ll empower a lot of parents to take that first step toward monitoring their child’s health. Keep iterating and adding more evidence‑based tips.
Kim M
December 25, 2025 AT 18:08Everything’s fine until pharma decides to push meds on kids 💊. Stay skeptical, and maybe double‑check the algorithm for hidden biases 😐.
Martin Gilmore
December 30, 2025 AT 11:28Honestly, this kind of health tool is exactly what our country needs-take charge of our kids’ health instead of waiting for foreign guidelines.